 NFT Collections")

Huge thanks to both @Joseinnewworld & @SVDG_XEC who are currently shopping my #NFTs at the same time — what a moment 🔥 Your support means a lot and keeps this journey alive. Grateful beyond words 🙏 #NFTcommunity #NFTCollection #eCash $XEC #Crypto https://t.co/2pkDOKjy2R pic.twitter.com/9dmsCqizFz
— NFToa (@nftoa_) June 25, 2025
How to Analyze a System
System analysis is an activity to find weaknesses in a system, so that improvements can be proposed. Identifying problems and analyzing needs. The analysis stage is important because errors in this stage can cause errors in the next stage.
Scope Determination
Software company "X" will develop a library information system at University "Y". The vision and mission of the university are:
Vision: To become a center for providing complete, effective, accurate and reliable library materials for computer science and information systems in the city of Z.
Mission: To increase public interest in accessing this library. To provide complete reference materials for computer sciences and information systems.
Objective
- Member growth per year is 10% per year.
- Increase member access by 2% per month
- Increase in book and reference resources by 3% per month.
Brief statement of the problem or opportunity:
- It is difficult to find precise and accurate book or reference information.
- It is difficult to collect data on members (both active and passive).
- It is difficult to record books that are still borrowed and those that have been returned.
- Member access interest is decreasing.
Of all the problems above, there is only one solution, namely developing a new system .
Problem analysis is the first step taken in the system analysis stage. A problem can be defined as a question that is desired to be solved. This problem is what causes the target of the system to not be achieved. Where each problem is analyzed for its causes and effects.
Steps to Start a Systems Analysis
- Determine system improvement objectives.
- The analysis team determines the criteria by which all improvements to the system will be measured and identifies the constraints that limit the flexibility of all those improvements.
- Communicating findings and recommendations.
Cause and Effect Analysis
Problem 1
- Book or reference information seeker
Cause and effect
- The catalog system is still manual
- It is difficult to find precise and accurate book or reference information.
Objective
- The existence of a computerized system that can help the book cataloging system.
System Limitations
- The system created must be user friendly, because users who will use this system are not very familiar with computer applications.
- Limited facilities and infrastructure at University X.
Problem 2
- Member registration.
Cause and effect
- The library member recording system is still done manually.
- It is difficult to record data on active and passive members.
Objective
- The existence of a computerized system that can serve the registration and data collection of library members so that it is easy to record data on active and passive members.
System Limitations
- Limited facilities and infrastructure at University X
- The system created must be able to record data on all active and passive members.
Problem 3
- Book loans and returns
Cause and effect
- The loan and repayment recording system is still done manually.
- It is difficult to record books that are still borrowed and those that have been returned.
Objective
- There is a computerized system that can record the borrowing and returning of books.
- Reduce the number of books lost/unreturned by members.
System Limitations
- The system created must be able to record book borrowing and returning transactions within 1 year.
- Limited facilities and infrastructure at University X.
Problem 4
- Number of members
Cause and effect
- Too complicated in doing the registration process
- Untidiness in storing documents means that members have to register as library members repeatedly.
- It's difficult to find book information.
- The number of members is declining.
Objective
- There is a 10% growth in library membership per year
- There is a computerized system that can help members search for books they want to borrow.
- There has been an increase in book borrowing by library members.
System Limitations
- Limited facilities and infrastructure at University X.
- The system created must be able to provide reports on book data, members and transactions (borrowing and returning books), so that it can provide initial information on the condition of the library.
Needs Analysis
The tasks in this phase are Identifying and stating system requirements. This task translates objectives into system requirements. System requirements are descriptions of the activities and services that must be provided by the system.
System requirements can be grouped into 2 categories:
- Functional requirements, requirements/features that must be present in the system/application being created
- Non-functional requirements, additional requirements required by the system.
Schedule Analysis
The CPM and PERT methods, which are program evaluation and review techniques (PERT) and critical path methods (CPM), were developed in the 1950s to help managers schedule, monitor, and control large, complex projects.
CPM first appeared, in 1957, as a tool developed by JE Kelly of Remmington Rand and MR Walker of duPont to assist in the construction and maintenance of chemical plants at duPont.
Separately, PERT was developed in 1958 by Booz, Allen, and Hamilton for the US Navy.
Process in PERTH
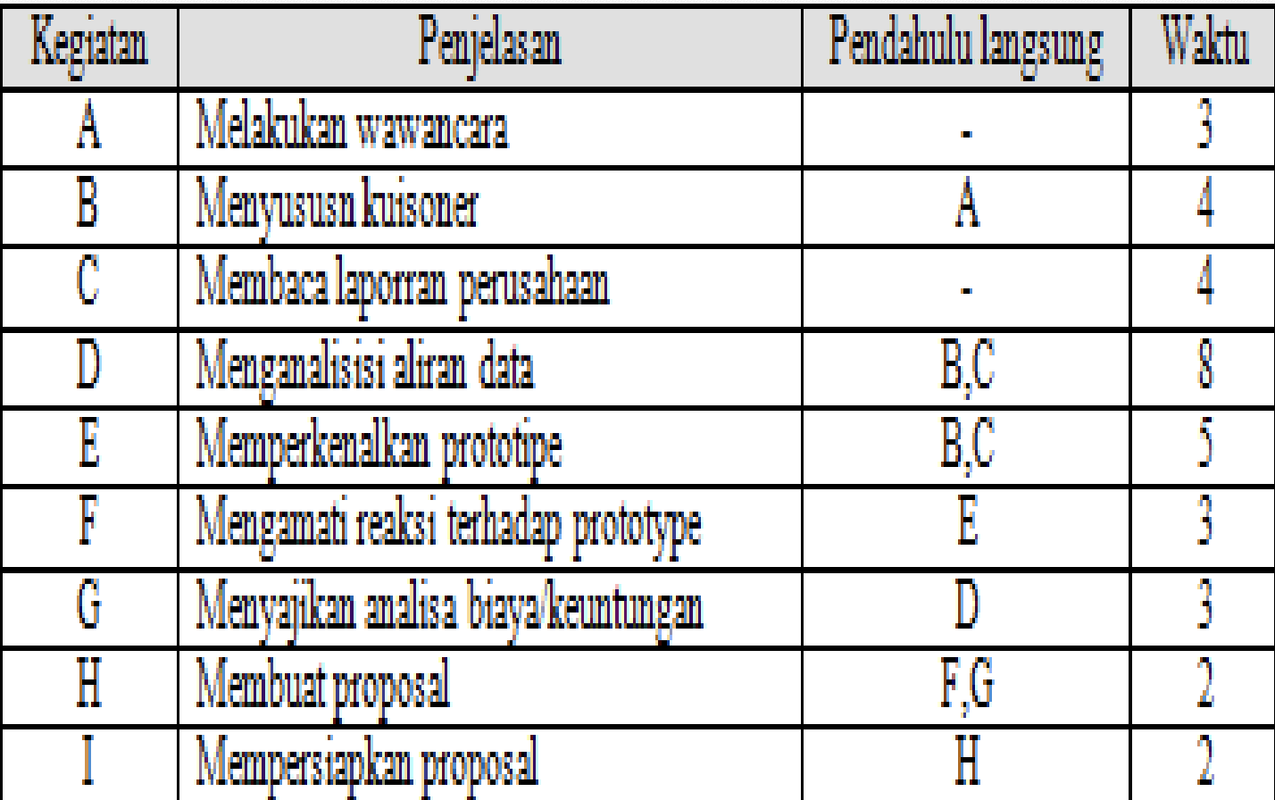
Know the sequence of activities for each job and its milestones. An activity is the work required to complete a project. Milestones are markers of events at the beginning and end of one or more activities. To identify activities and milestones, you can use a table to make it easier to understand and add other information such as sequence and duration.
Example
Software company X will build a library information system. The library information system will be proposed with the following sequence of activities to be carried out:
- Conducting an interview
- Compiling a questionnaire
- Reading company reports
- Analyzing data flow
- Introducing the prototype
- Presenting cost/benefit analysis
- Making a proposal
- Preparing the proposal
Creating a network diagramAfter getting the sequence of work on a job, a diagram can be created. The diagram will show the jobs that must be done sequentially (serially) or simultaneously (parallel).
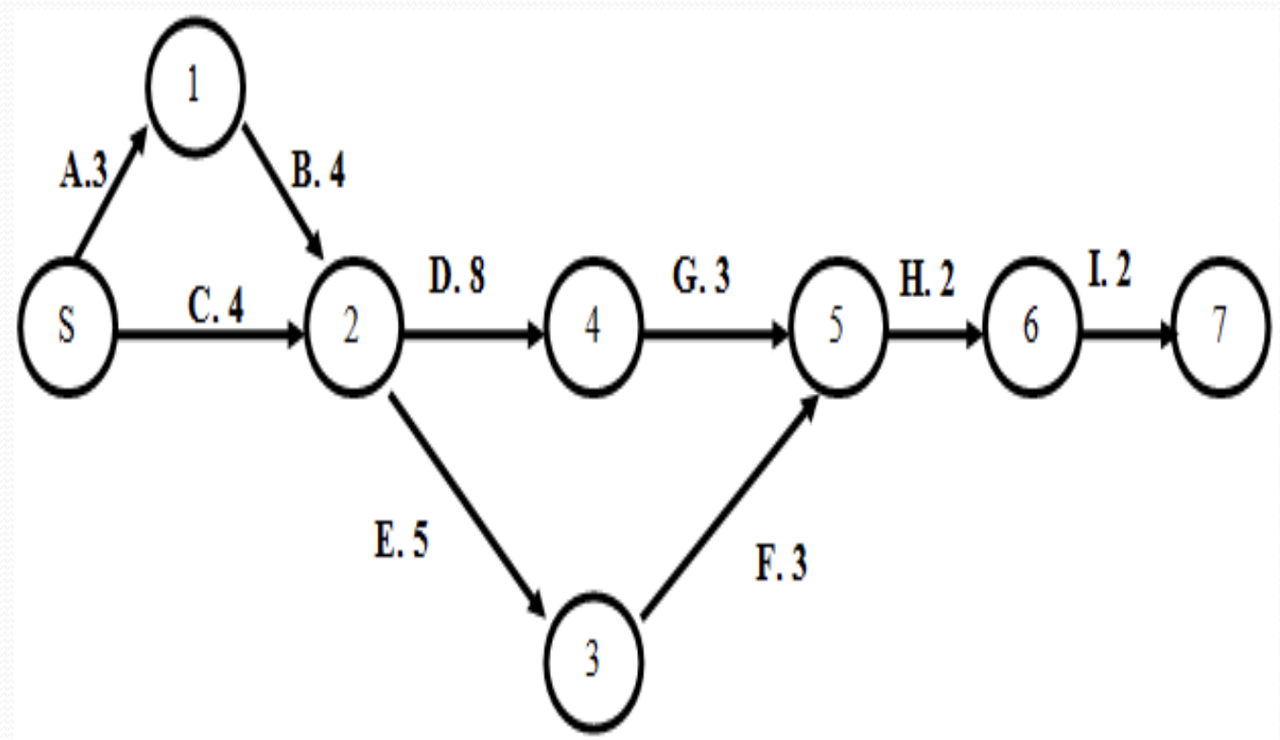
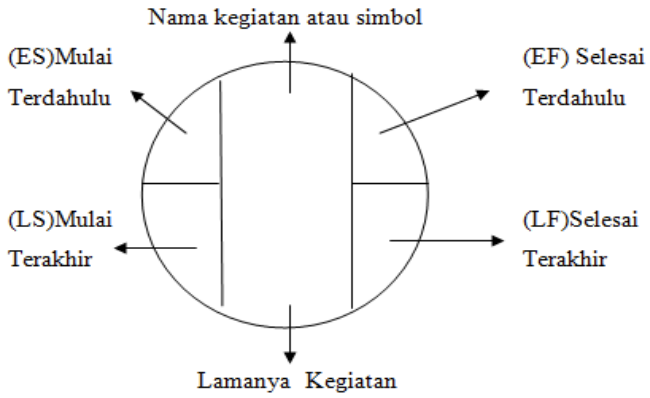
Establishing a critical pathA critical path can be obtained by adding the time of an activity to each work sequence and determining the longest path for each project. Usually a critical path consists of jobs that cannot be postponed. In each work sequence there is a time marker that can help in establishing the critical path, namely:
- ES – Early start
- EF – Early finish
- LS – latest start
- LF – latest finish.
By using the four time marker components, a critical path can be obtained according to the diagram.
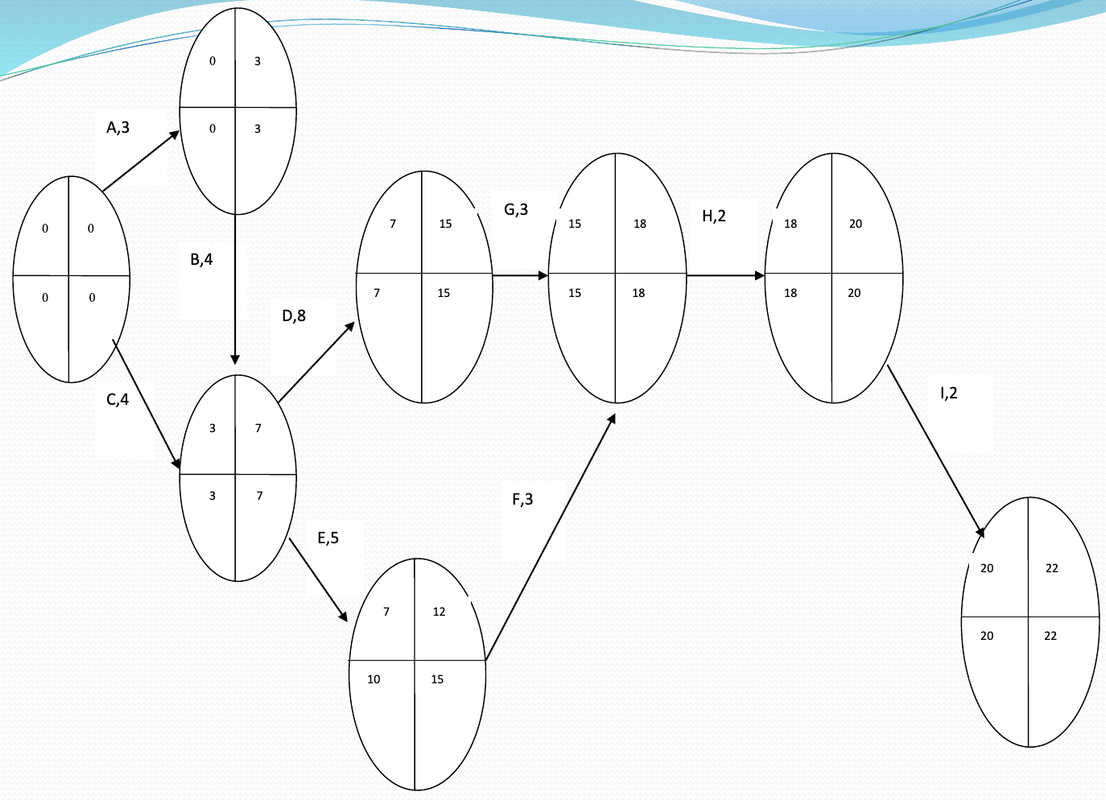
Determining a project schedule or activity schedule means we need to identify the start time and finish time for each activity.
We use a two-pass process, consisting of a forward pass (to calculate ES-Earlist Start and EF-Earlist Finish) and a backward pass (to calculate LS-latest start and LF-latest finish) to determine the time schedule for each activity.
Forward pass, is an identification of previous times. The rules for previous start times:
- Before an activity can begin, its immediate predecessor must be completed.
- If an activity has only one direct predecessor, its ES is the same as the EF of its predecessor.
- If an activity has more than one immediate predecessor, its ES is the maximum value of all its predecessor EFs, i.e. ES = max [EF of all immediate predecessors]
- If an activity has only one immediate predecessor, EF = ES + Activity Time
- If an activity has more than one immediate predecessor, its EF is the maximum value of all its predecessors, namely EF= max [ES+Activity Time]
- The backward pass begins with the last activity of a project. For each activity we first determine its LF value, followed by its LS value.
- If an activity is an immediate predecessor to only one activity, its LF is equal to the LS of the activity that immediately follows it.
- If an activity is a direct predecessor to more than one activity, then the LF is the minimum of all the LS values of the activities that directly follow it, i.e. LF = Min [LS of all direct activities that directly follow it]
- If an activity is a direct predecessor to only one activity, LS = LF – Activity Time
- If an activity is a direct predecessor to more than one activity, then LS = Min [LF-Activity Time].
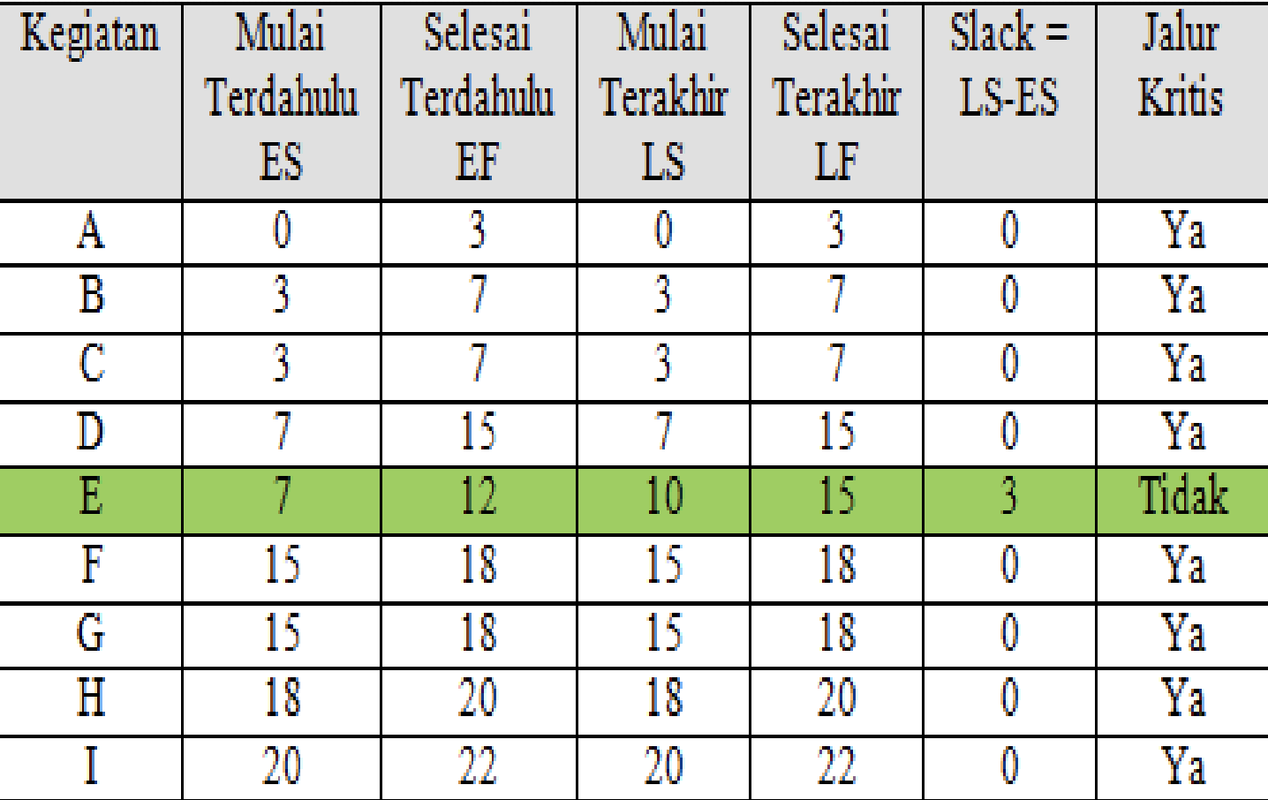
The next step is to calculate the slack activity and critical path values.
Slack time is the free time that each activity has to be postponed without causing delays to the overall project.
Mathematically, slack time can be formulated as follows:
Slack = LS – ES or Slack = LF – EF
Determine the critical path for the earliest start time and latest finish time for each activity.
The critical path is an activity that has no lead time (S=0), meaning that the activity must start exactly at ES so as not to increase the project completion time.
Activities with slack = 0 are called critical activities and are on the critical path.
The next step is to determine the probabilistic activity times. In PERT, we use probability distributions based on three time estimates for each activity, namely:
Optimistic time [a]
Optimistic time is the time needed by an activity if everything goes according to plan. Or it can also be called the minimum time of an activity, where everything will go well, it is very unlikely that the activity will finish before this time.
Pessimistic time
Pessimistic time is the time required for an activity assuming that the existing conditions are very undesirable. Or it can also be called the maximum time required for an activity, this situation occurs when bad luck occurs.
Realistic time (most likely time) [m]
Realistic time is the most realistic estimate of the time required to complete an activity. Or it can also be called the normal time to complete an activity.
To find the company's expected time and its variance, the following calculations are made: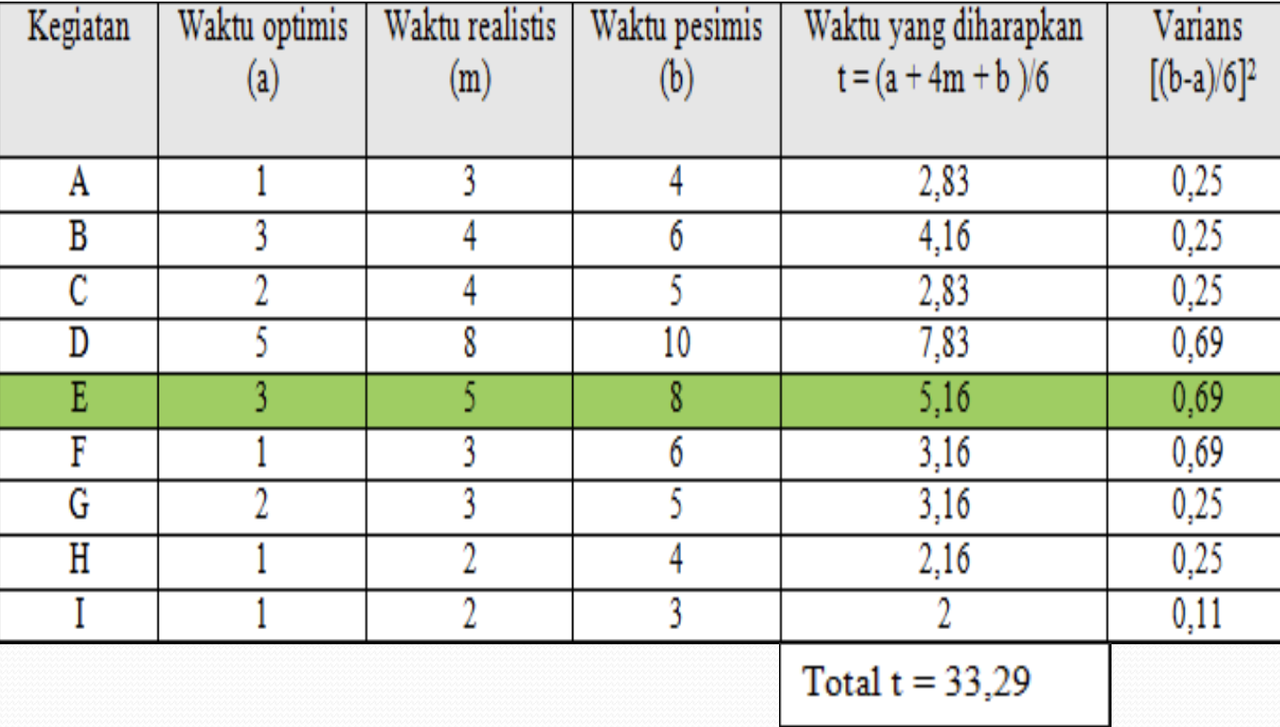
To calculate the overall project variance and its standard deviation, it is calculated using the specified formula, namely:
S2 = Project variance = Sigma (variance of activities on the critical path)
S2 = variance A + variance B + variance C + variance D + variance F + variance G + variance H + variance I
S2 = 2.74
Standard deviation (S)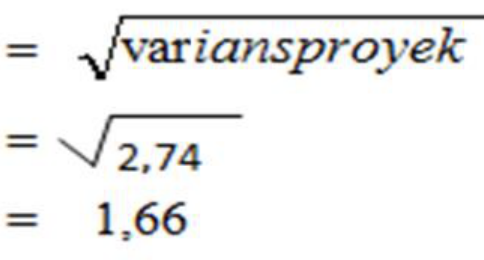
Then the company sets a deadline for completing the project, which is 35 days, while the deadline expected by software company X is 33.29 days, then the normal deviation value:
(Z)
= [deadline (n) - expected completion time] / S
= (35 days - 33.29 days) / 1.66
= 1.71 / 1.66
= 1.03
Normal distribution table: With Z = 1.03
, Ztable can be determined using the normal distribution table, and Ztable = 0.3485 is obtained.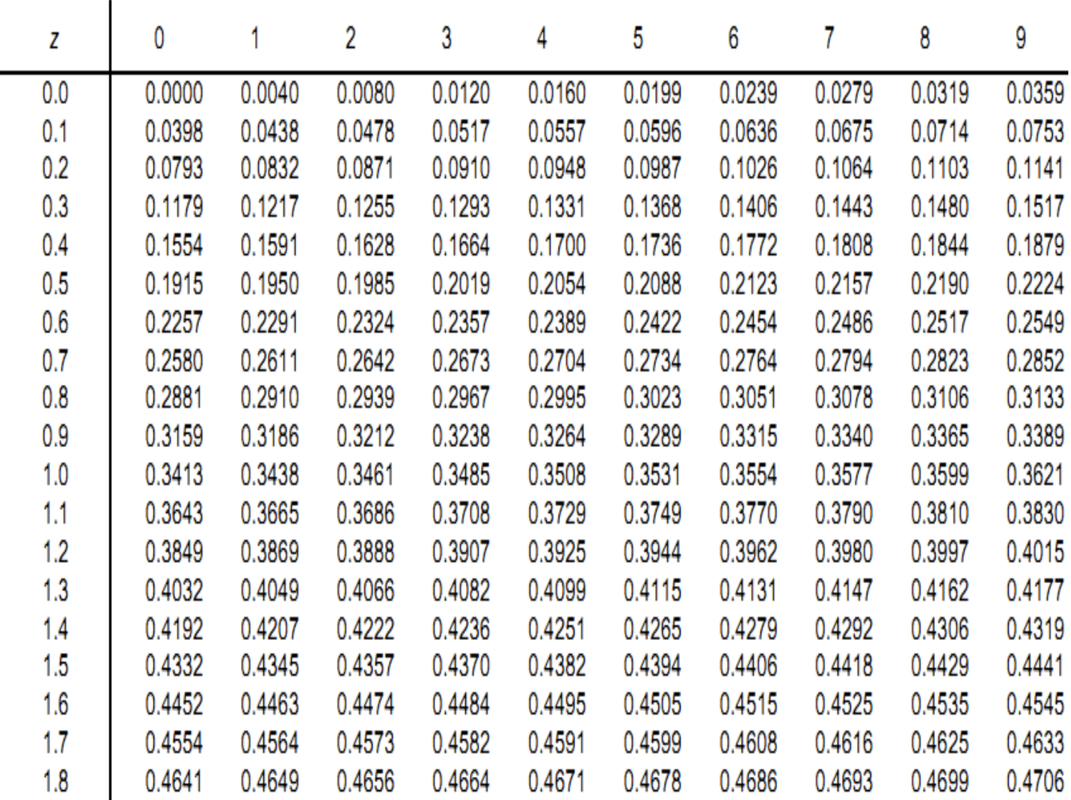
So the probability project completion in 35 weeks is:
- P = Ztable + 0.5000
- so P = 0.3485 + 0.5000 = 0.8485
How to Design a System
Robert J. Verzello/John Reuter III argues that system design is the stage after analysis of the system development cycle, namely the definition of functional requirements and preparation for implementation design, such as describing how a system is formed.
Meanwhile, John Burch & Gary Grudnitski argue that system design is the depiction, planning and sketching or arrangement of several separate elements into a complete and functional unit.
Meanwhile, George M. Scott argues that system design is determining how a system will accomplish what must be accomplished. This stage involves configuring the software and hardware components of a system so that after installation the system will truly satisfy the design that was set at the end of the analysis stage.
Conclusion
- After the analysis phase of the systems development cycle
- Definition of functional requirements
- Preparation for implementation design
- Describes how a system is formed
- It can be in the form of depictions, planning and making sketches or arrangements of several separate elements into a complete and functional unit.
- Including configuring the software and hardware components of a system.
Data Flow Diagram
- DFD was introduced by Tom DeMarco as well as Chris Gane and Trish Sarson.
- DFD is a graphical display that shows the relationship between processes and data along with a data dictionary that explains the details of the data used.
- This diagram is also used to describe the flow of data in a system, the sources and destinations of data, the processes that process the data, and where the data is stored.
DFD is a technique that is quite important in analyzing systems because:
- Can define system boundaries.
- Helps check the accuracy and completeness of information flow.
- It is the basis for design by bringing up data processing processes.
Elements in DFD
There are four elements that form a Data Flow Diagram, namely.
1]. Data Flow
- A link between processes that represents the information required by the process as input or the information produced by the process as output.
- This data flow flows between processes, data storage and external entities.
- Named according to the substance of the contents of the flowing information package.
2]. Process
- Transformation of incoming data streams into outgoing data streams.
- Transformation is how one or more inputs are changed into outputs.
- Explains what data transformation processes exist in the system or that must be carried out by the system.
- Given a name and number that will be used for identification purposes.
- The name given should be able to describe what the process does.
- Process names are usually written in verb form.
3]. Data Storage (Data Store)
- Data storage place or place of data referenced by the process.
- A collection of data packets that the system must remember within a certain period of time.
- At the end of system development, the data store is usually implemented as a file or database.
4]. External Entity/Terminator/ Source or Sink
- It is an entity in the external environment.
- It can be a person, organizational unit or other system in the external environment that will provide input or receive output from the system.
- The number of entities associated at one level will appear in the same number for other levels.
Basic Rules of DFD
Process
- No process has only output data. If that is the case, then the object is a data source.
- It is not allowed to have only input data (black hole). If that happens, then the object is the data destination.
- Process names must use verbs (e.g. print a report) or distinct names (e.g. print a report).
Data Store
- Data cannot flow directly from one data store to another. Data must first move through a process.
- Data cannot flow directly from a data source to a data store. Data must first move through a process.
- Data cannot flow directly from the data store to the data destination, the data must go through a process first.
- Data store names must use nouns (e.g. goods).
External Entities (Data Sources or Destinations)
- Data cannot flow directly from the data source to the data destination. Data must go through a process first. If there is, it is not depicted in the DFD.
- The name of the data source or destination must use a noun (e.g. operator).
Data Flow
- Data flow can only have one direction of data flow between one symbol and another. Bidirectional flow can occur between processes and data stores, indicating data reading before data is updated, which is identified by two separate directions that occur at different times or the depiction of the arrows must not be double.
- The same data flow going to different processes, data stores, data sources or destinations may be depicted as branching.
- The same data flow from multiple processes, data stores, data sources or destinations towards a particular process may be depicted as branching.
- Data flow should not flow directly into itself (circular). The data flow must be processed by at least one or more processes that will produce several other data flows and return to the original data flow to the initial process.
- The flow of data to the data store means updating data, either by deleting data or changing data.
- Data flow from a data store means the process of retrieving or reading data in the data store.
- Data flow names use nouns. Multiple data flows can be used for one arrow, as long as all the data names are a single data package.
DFD Levels
DFD Level . Context Diagram Describes in general the context that occurs in the system between the internal world and the external world that borders. It is the top layer of the system that will be discussed.
Zero diagram (overview diagram) . Zero diagram provides a comprehensive view of the system being handled, showing the main functions or processes that exist, data flow, and external entities. At this level, it is possible to describe the data store used.
Detailed Diagram (Level Diagram) . A detailed diagram is a diagram that describes what processes are in the zero diagram or the level diagram above it. The balance of input and output (balancing) between the 0 diagram and the context diagram must be maintained.
Level Numbering in DFD
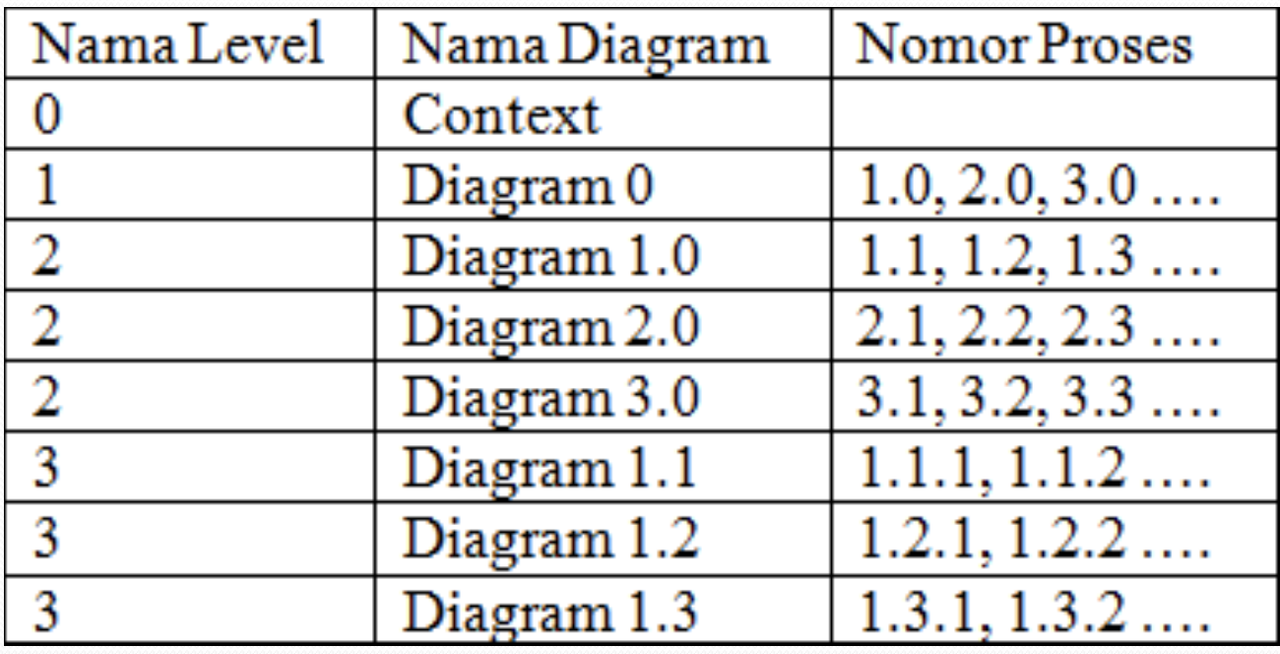
In one level there should be no more than 7 processes and a maximum of 9, if more then decomposition must be carried out.
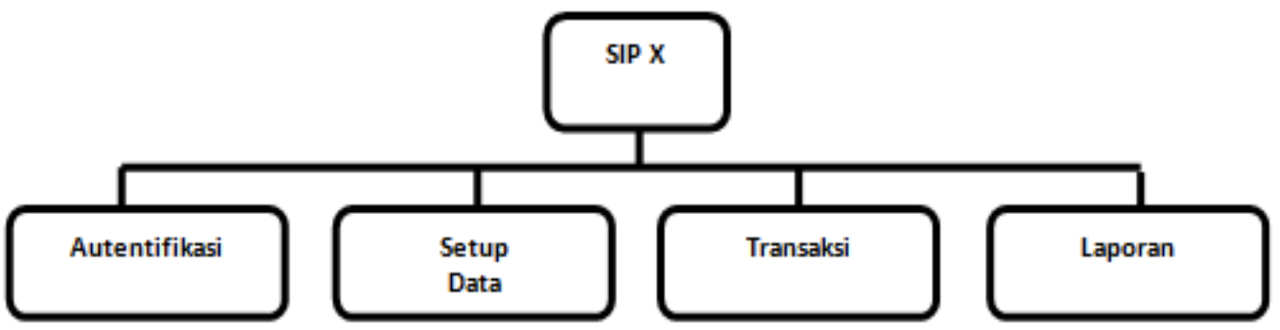
Tiered Chart
Before creating a DFD, it is recommended to decompose/design the menu that will be created in the software.
Guidelines for creating DFD
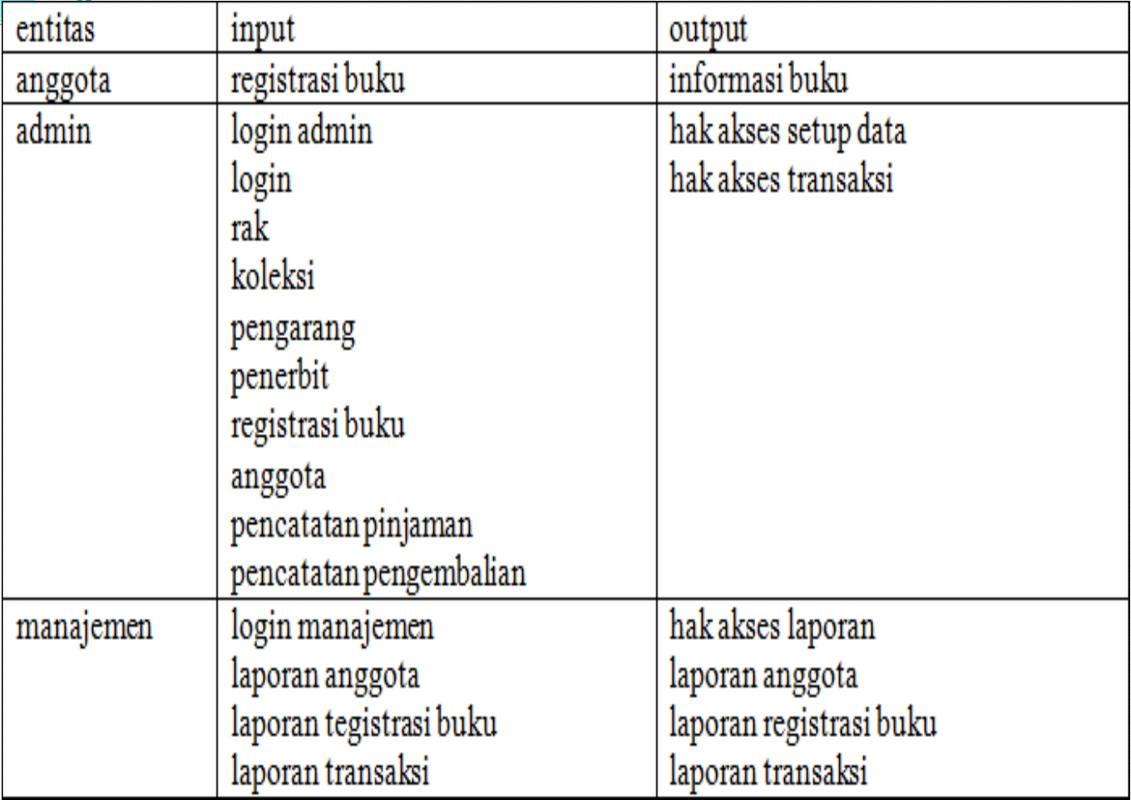
- First identify all external entities involved in the system
- Identify all inputs and outputs involved with the external entity.
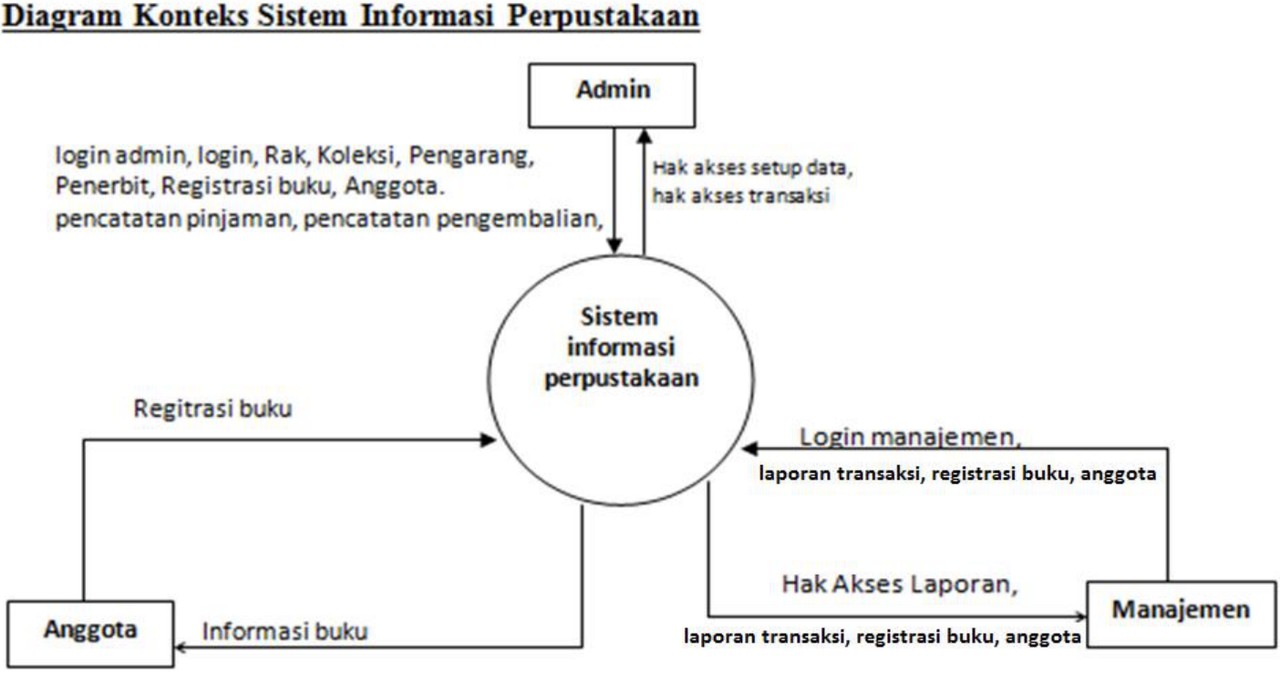
- First draw a context diagram, depicting the system first in outline (called top level). A context diagram always contains one and only one process. This process represents the process of the entire system. This context diagram only depicts the input/output relationship between the system and its external world (external entity).
- Draw a hierarchical chart for all processes in the system first. Hierarchical charts are used to prepare the drawing of DAD to lower levels. Hierarchical charts can be drawn using the process notation used in DAD.
- Draw a DAD sketch for the overview diagram (level 0) based on the processes in the hierarchical chart.
- Draw the DAD for the next levels, namely level 1 and so on. Each process is broken down according to its tiered chart.
Context Diagram
System design based on DFD
Nowadays it is known as UI/UX Design, which is a discipline that focuses on designing system interfaces for users by paying attention to psychological and effectiveness aspects.